import matplotlib.pyplot as plt
import six
fig = plt.figure()
ax = fig.add_subplot(111)
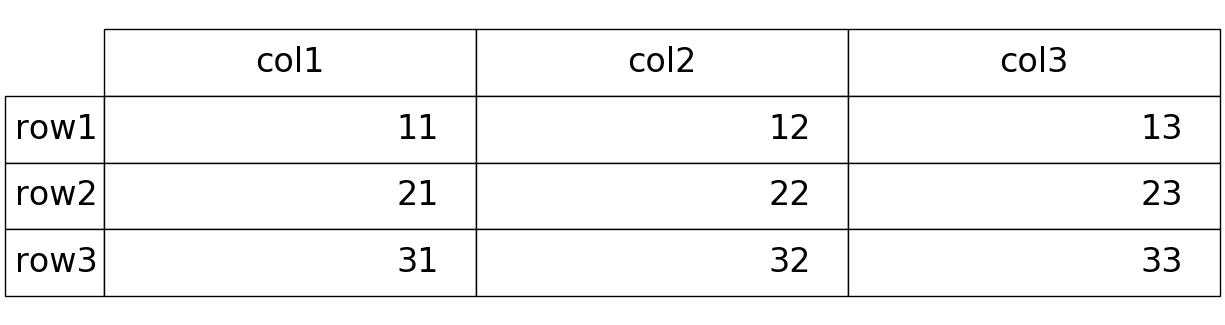
col_labels = ['col1', 'col2', 'col3']
row_labels = ['row1', 'row2', 'row3']
table_vals = [[11, 12, 13], [21, 22, 23], [31, 32, 33]]
# Draw table
the_table = plt.table(cellText=table_vals,
colWidths=[0.1] * 3,
rowLabels=row_labels,
colLabels=col_labels,
loc='center')
the_table.auto_set_font_size(False)
the_table.set_fontsize(24)
the_table.scale(4, 4)
# Removing ticks and spines enables you to get the figure only with table
plt.tick_params(axis='x', which='both', bottom=False, top=False, labelbottom=False)
plt.tick_params(axis='y', which='both', right=False, left=False, labelleft=False)
for pos in ['right','top','bottom','left']:
plt.gca().spines[pos].set_visible(False)
plt.savefig('matplotlib-table', bbox_inches='tight', pad_inches=0.05)
plt.show()
import six
ax = fig.add_subplot(111)
col_labels = ['col1', 'col2', 'col3']
row_labels = ['row1', 'row2', 'row3']
table_vals = [[11, 12, 13], [21, 22, 23], [31, 32, 33]]
# Draw table
the_table = plt.table(cellText=table_vals,
colWidths=[0.1] * 3,
rowLabels=row_labels,
colLabels=col_labels,
loc='center')
the_table.auto_set_font_size(False)
the_table.set_fontsize(24)
the_table.scale(4, 4)
# Removing ticks and spines enables you to get the figure only with table
plt.tick_params(axis='x', which='both', bottom=False, top=False, labelbottom=False)
plt.tick_params(axis='y', which='both', right=False, left=False, labelleft=False)
for pos in ['right','top','bottom','left']:
plt.gca().spines[pos].set_visible(False)
plt.savefig('matplotlib-table', bbox_inches='tight', pad_inches=0.05)
plt.show()
(1) fig = plt.figure(figsize=(width height))
figの大きさを指定できる。値を指定しない場合のデフォルトは
[6.4, 4.8].(2) Titleを付ける場合
ax.set_title(label='TOP 10 Stock Price Gainer ', fontsize=25,
loc="left", pad=0.5,
backgroundcolor='green',
color='white',
verticalalignment= 'baseline')
(2) ax =fig.add_subplot(111)
# figure内の枠の大きさとどこに配置している。subplot(行の数,列の数,何番目に配置しているか)

(3) 表を作成する
(Subplot Parameterの指定)
plt.subplots_adjust(
left=0.22,
bottom=0.11,
right=0.65,
top=0.88,
wspace=0.20,
hspace=0.20)
left = 0.125 # the left side of the subplots of the figure
right = 0.9 # the right side of the subplots of the figure
bottom = 0.1 # the bottom of the subplots of the figure
top = 0.9 # the top of the subplots of the figure
wspace = 0.2 # the amount of width reserved for space between subplots,
# expressed as a fraction of the average axis width
hspace = 0.2 # the amount of height reserved for space between subplots,
# expressed as a fraction of the average axis height
(列幅の指定)
colWidths=[0.1] * 3,
列幅を変える場合は、それぞれ指定する。
colWidths=[0.5, 0.1, 0.2]
(テーブルの場所)
loc=’center’ :表を中央に配置する。
(画像ファイルにした際に表示される大きさ(Scale))
the_table.scale(5, 5)
( width 5 inches, and its height 5 inches.)
(4) 表の表示の削除
plt.tick_params(axis='x', which='both', bottom=False, top=False, labelbottom=False)
plt.tick_params(axis='y', which='both', right=False, left=False, labelleft=False)
又は
plt.axis(‘off’)
(セルの色を変える)
# Cell Coloring
for col in range(data_len):
col_num= data_len-(col+1)
if data['Close'][col_num]-data['Close'][col_num-1]>0:
the_table[(col+1,5)].set_facecolor('#adff2f')
else:
the_table[(col+1,5)].set_facecolor('#ff0000')

(セルの色を変える:)
table.properties()メソッドやset_text_props()等を使って変更
https://matplotlib.org/3.1.0/api/table_api.html
# Cell Coloring
table_props = the_table.properties()
table_cells = table_props['child_artists']
for i in range(4):
the_table[(0,i)].set_facecolor('green')
the_table[(0,i)].get_text().set_fontsize('25')
the_table[(0,i)].get_text().set_color('white')
the_table[(0,i)].get_text().set_fontweight('bold')
for i in range(len(to_csv)):
n =i +1
the_table[(n,0)].get_text().set_fontweight('bold')
the_table[(n,0)].get_text().set_fontsize('35')

https://www.geeksforgeeks.org/matplotlib-axes-axes-table-in-python/
0 件のコメント:
コメントを投稿